Unveiling the Power of Rectangles in Technical Analysis 2024
In the dynamic world of financial markets, technical analysis serves as a crucial tool for traders and investors alike. Among the plethora of chart patterns used in technical analysis, the rectangle pattern stands out for its simplicity and effectiveness. By understanding the intricacies of rectangles, traders can unlock valuable insights into market trends and make informed decisions. In this comprehensive guide, we’ll delve into the nuances of rectangle patterns, exploring their significance, characteristics, and practical applications in trading.
What Exactly is a Rectangle Pattern?
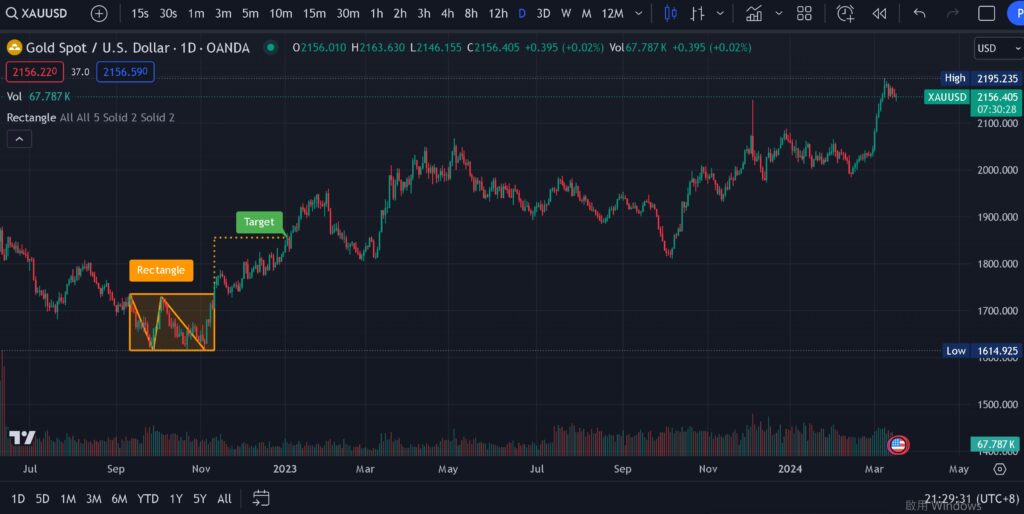
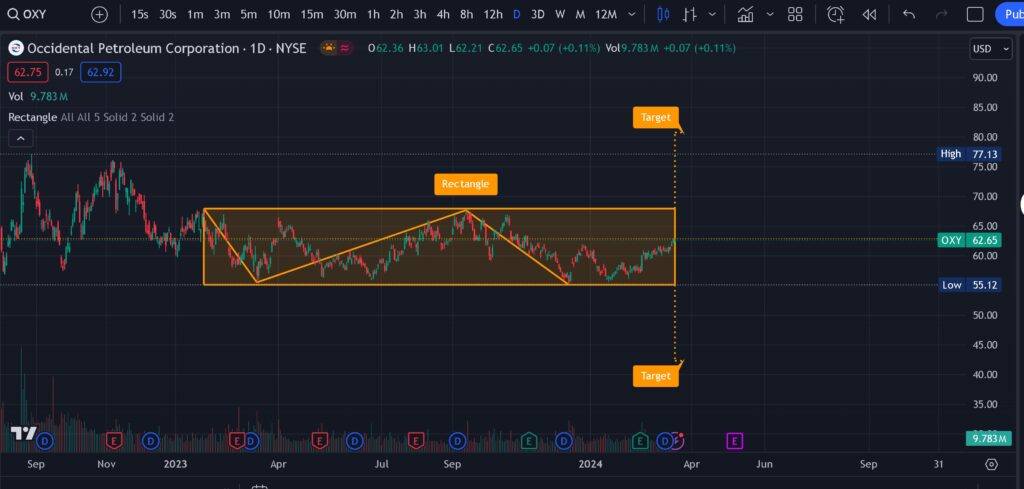
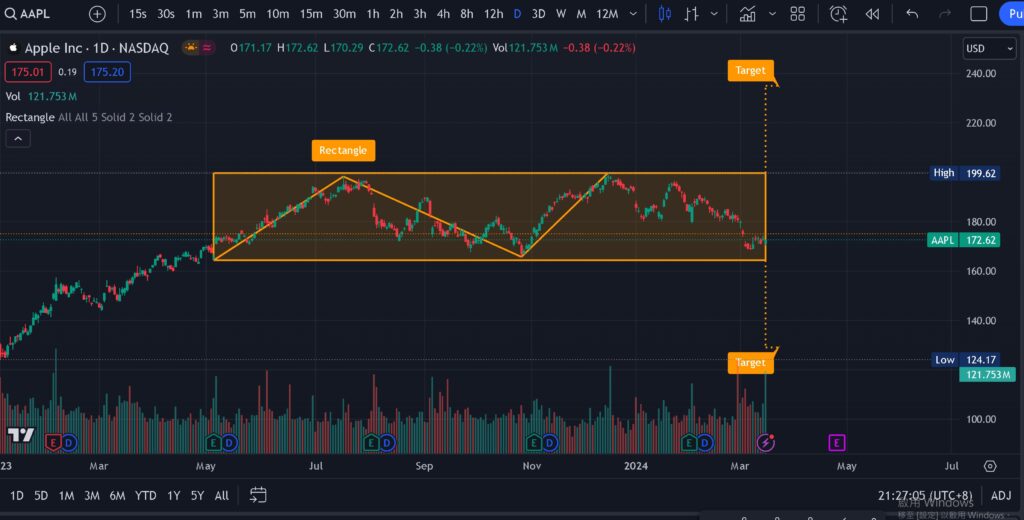
A rectangle pattern, often referred to as a trading range, is a formation on a price chart characterized by horizontal lines that represent support and resistance levels. Visually, it resembles a rectangle, as the price oscillates within a confined range, creating a flat top and bottom. This pattern signifies a period of consolidation where neither buyers nor sellers have gained dominance, resulting in a balance between supply and demand.
Identifying Rectangle Patterns
Recognizing rectangle patterns is essential for traders seeking to capitalize on market opportunities. Here are key features to look for when identifying this pattern:
1. Horizontal Boundaries: Rectangles are defined by two parallel horizontal lines, representing the upper resistance level and the lower support level.
2. Consistent Price Action: Within the rectangle, prices tend to move sideways with minimal volatility, forming a flat top and bottom.
3. Volume Analysis: During the formation of a rectangle, trading volume often diminishes, indicating a lack of significant buying or selling pressure.
4. Duration: Rectangles can persist for varying durations, ranging from a few days to several months, depending on market conditions.
The Significance of Rectangle Patterns
Rectangle patterns hold substantial significance for technical analysts and traders due to several reasons:
1. Price Consolidation: Rectangles represent a period of price consolidation, indicating a temporary pause in the prevailing trend. This consolidation phase provides valuable insights into market sentiment and potential future price movements.
2. Breakout Opportunities: Rectangles serve as reliable indicators of potential breakout opportunities. Traders often anticipate a breakout when the price approaches the boundaries of the rectangle, signaling a potential shift in market momentum.
3. Risk Management: By identifying support and resistance levels within a rectangle, traders can effectively manage risk by placing stop-loss orders and determining optimal entry and exit points for trades.
4. Measuring Price Targets: The height of a rectangle pattern can be used to estimate price targets following a breakout. Traders typically measure the distance between the support and resistance levels and project it upwards or downwards from the breakout point to determine potential price targets.
Practical Applications in Trading
Understanding how to interpret and trade rectangle patterns can enhance trading strategies and improve overall performance. Here are some practical applications:
1. Breakout Trading: Traders often wait for a confirmed breakout from a rectangle pattern before initiating trades. A breakout above the upper resistance level suggests bullish momentum, while a breakout below the lower support level indicates bearish sentiment.
2. Range-Bound Strategies: During periods of consolidation within a rectangle, traders can employ range-bound strategies such as buying near the support level and selling near the resistance level. This approach allows traders to capitalize on short-term price fluctuations within the trading range.
3. Confirmation Signals: To validate the strength of a breakout, traders may look for confirmation signals such as increased volume and price continuation in the direction of the breakout. These signals help confirm the validity of the breakout and reduce the likelihood of false signals.
Conclusion
In conclusion, rectangle patterns play a pivotal role in technical analysis, providing traders with valuable insights into market dynamics and potential trading opportunities. By mastering the art of identifying and interpreting rectangle patterns, traders can gain a competitive edge in navigating the complexities of financial markets. Whether you’re a seasoned trader or a novice investor, incorporating rectangle patterns into your technical analysis arsenal can lead to more informed decision-making and improved trading outcomes. So, keep an eye out for those rectangular formations on your price charts—they may just hold the key to unlocking profitable trading opportunities.
Hashtags
- #TechnicalAnalysis
- #RectanglePatterns
- #TradingStrategies
- #InvestingTips
- #MarketAnalysis
- #TradingEducation
- #ChartPatterns
- #FinancialMarkets
- #StockMarket
- #ForexTrading
SEO Tags
- Rectangle in the Technical Analysis
- Technical Analysis
- Rectangle Patterns
- Trading Strategies
- Market Analysis
- Chart Patterns
- Stock Market
- Forex Trading
- Investing Tips
- Financial Markets
- Trading Education
- Trading Patterns
- Price Action
- Support and Resistance
- Breakout Trading
- Market Trends
- Trading Signals
- Candlestick Patterns
- Day Trading
- Swing Trading
- Trend Analysis
- Momentum Trading
- Volatility Analysis
- Risk Management
- Price Targets
- Breakout Opportunities
- Trading Psychology
- Technical Indicators
- Moving Averages
- Relative Strength Index (RSI)
- Moving Average Convergence Divergence (MACD)
- Bollinger Bands
- Fibonacci Retracement
- Market Sentiment
- Financial Analysis
The patterns mentioned above no longer require manual drawing. You can directly use TradingView to automatically plot these patterns. You can find more information about TradingView and its features, including pattern recognition tools, on their website: TradingView Pricing