Ascending Triangle: A Powerful Pattern in Technical Analysis
In the realm of technical analysis, traders often rely on various patterns and indicators to make informed decisions about buying and selling assets. One such pattern that has garnered significant attention is the ascending triangle. This pattern, characterized by its distinct shape and implications, can offer valuable insights into potential price movements of an asset. In this article, we’ll delve into what an ascending triangle is, how to identify it, and how traders can effectively utilize it in their trading strategies.
Understanding the Ascending Triangle Pattern
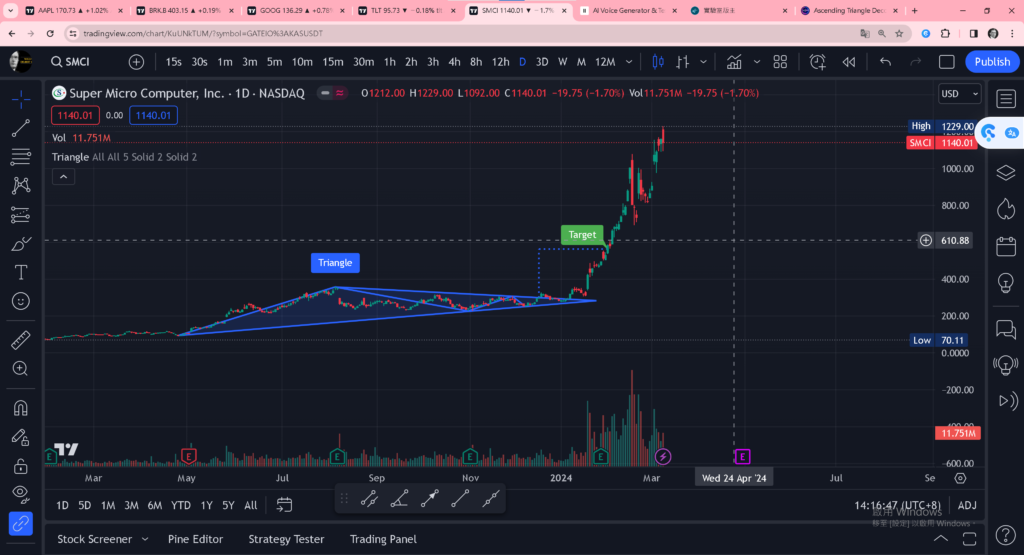
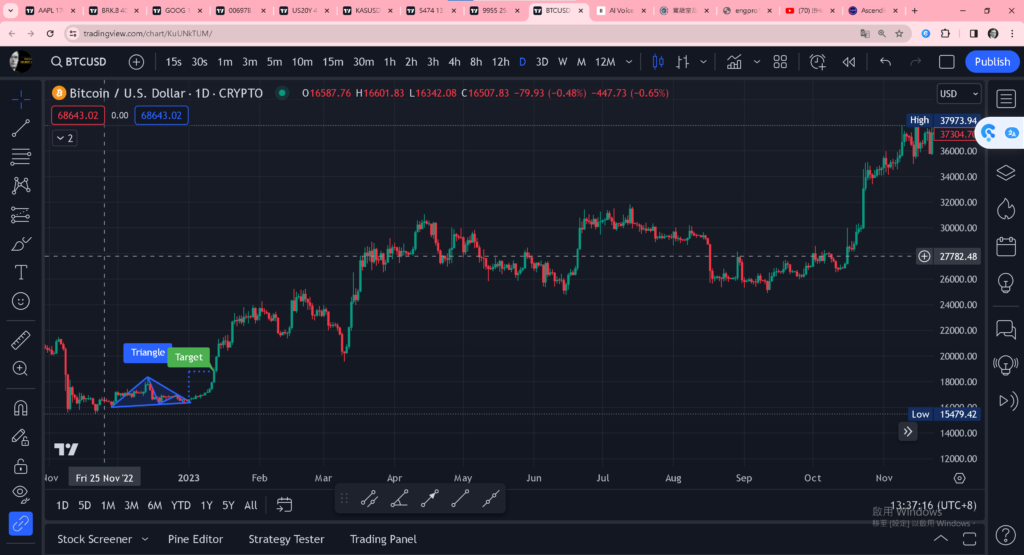
An ascending triangle is a bullish continuation pattern that typically forms during an uptrend. It consists of two key elements: a horizontal resistance line and a rising trendline. Visually, it resembles a triangle with a flat top and an ascending bottom. The formation of this pattern suggests that buyers are gradually gaining control over the asset’s price, leading to higher lows but with resistance keeping the price from rising further.
Identifying the Ascending Triangle
Recognizing an ascending triangle on a price chart requires a keen eye for detail. Traders should look for the following characteristics:
- Horizontal Resistance Line: This line connects at least two high points where the price struggled to break above, creating a flat top for the triangle.
- Rising Trendline: The lower boundary of the triangle is formed by connecting a series of higher lows, indicating an upward trend in price.
- Decreasing Volume: As the pattern develops, trading volume typically diminishes, signaling a period of consolidation before a potential breakout.
Implications of the Ascending Triangle
The ascending triangle pattern carries significant implications for traders:
- Bullish Bias: The formation of higher lows indicates increasing buying pressure, suggesting that a breakout to the upside is more likely.
- Price Targets: Traders often use the height of the triangle at its widest point to estimate potential price targets once the breakout occurs.
- Confirmation: A breakout occurs when the price closes above the horizontal resistance line, confirming the pattern and signaling a potential uptrend continuation.
Trading Strategies with the Ascending Triangle
Traders employ various strategies when trading ascending triangles:
- Breakout Trading: Traders enter long positions once the price breaks above the horizontal resistance line, accompanied by high volume, signaling a bullish breakout.
- Pullback Entry: Some traders wait for a pullback to the breakout level before entering a long position, using the former resistance as support.
- Stop-Loss Placement: Placing a stop-loss order below the ascending trendline or the breakout point can help mitigate risk in case of a false breakout.
Real-World Example: Trading the Ascending Triangle
Let’s consider a hypothetical scenario involving Company XYZ’s stock. After a prolonged uptrend, the stock begins to consolidate, forming an ascending triangle pattern. Traders notice decreasing volume and anticipate a breakout to the upside. Once the price closes above the resistance line on high volume, traders enter long positions, targeting a price objective based on the triangle’s height.
Conclusion
The ascending triangle pattern is a powerful tool in a trader’s arsenal, providing valuable insights into potential price movements and trend continuations. By understanding its formation, identifying key characteristics, and implementing effective trading strategies, traders can capitalize on opportunities in the market and enhance their overall profitability. As with any technical pattern, it’s essential to combine it with other forms of analysis and risk management techniques for optimal results.
FAQs
Q1: What is an ascending triangle pattern in technical analysis? A1: An ascending triangle pattern is a bullish continuation pattern that typically forms during an uptrend. It consists of a horizontal resistance line and a rising trendline, resembling a triangle with a flat top and ascending bottom.
Q2: How can traders identify an ascending triangle pattern? A2: Traders can identify an ascending triangle pattern by looking for specific characteristics on a price chart, including a horizontal resistance line connecting at least two high points, a rising trendline formed by higher lows, and decreasing trading volume as the pattern develops.
Q3: What are the implications of the ascending triangle pattern for traders? A3: The ascending triangle pattern implies increasing buying pressure, suggesting a potential breakout to the upside. Traders often use the height of the triangle to estimate price targets once the breakout occurs, and a breakout confirms the pattern, signaling a potential uptrend continuation.
Q4: What trading strategies can traders employ with the ascending triangle pattern? A4: Traders can utilize various trading strategies with the ascending triangle pattern, including breakout trading, pullback entry, and stop-loss placement. Breakout trading involves entering long positions once the price breaks above the horizontal resistance line with high volume, while pullback entry involves waiting for a pullback to the breakout level. Stop-loss placement helps mitigate risk in case of a false breakout.
Q5: Can you provide a real-world example of trading the ascending triangle pattern? A5: Yes, let’s consider a hypothetical scenario involving Company XYZ’s stock. After a prolonged uptrend, the stock begins to consolidate, forming an ascending triangle pattern. Traders notice decreasing volume and anticipate a breakout to the upside. Once the price closes above the resistance line on high volume, traders enter long positions, targeting a price objective based on the triangle’s height.