Understanding the Descending Triangle Pattern

In the realm of technical analysis, certain patterns emerge on price charts, providing valuable insights into market dynamics and potential future price movements. One such pattern is the Descending Triangle, a bearish continuation pattern characterized by a series of lower highs meeting a horizontal support line. In this article, we will delve deep into the intricacies of the Descending Triangle pattern, exploring its formation, interpretation, and practical implications for traders and investors alike.
Formation of Descending Triangle
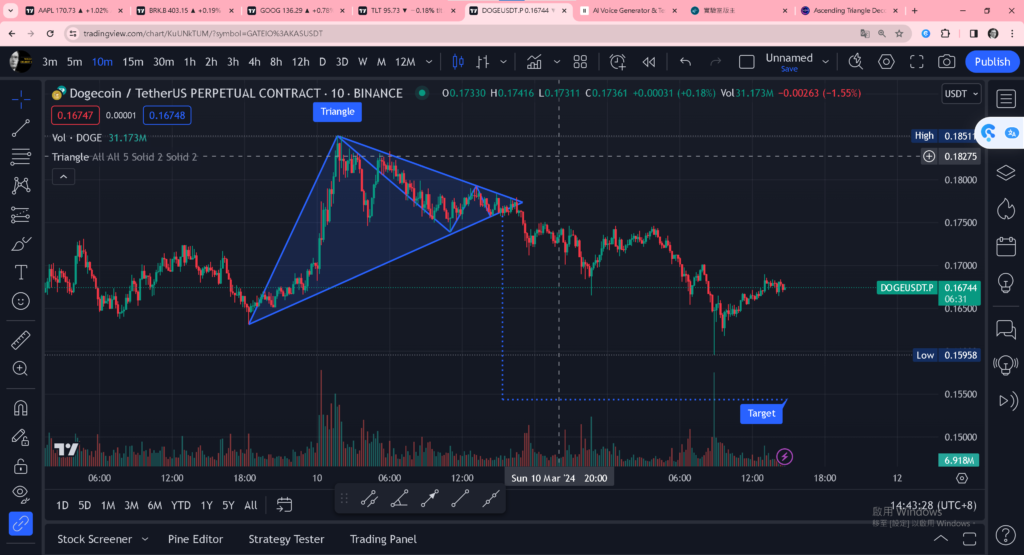
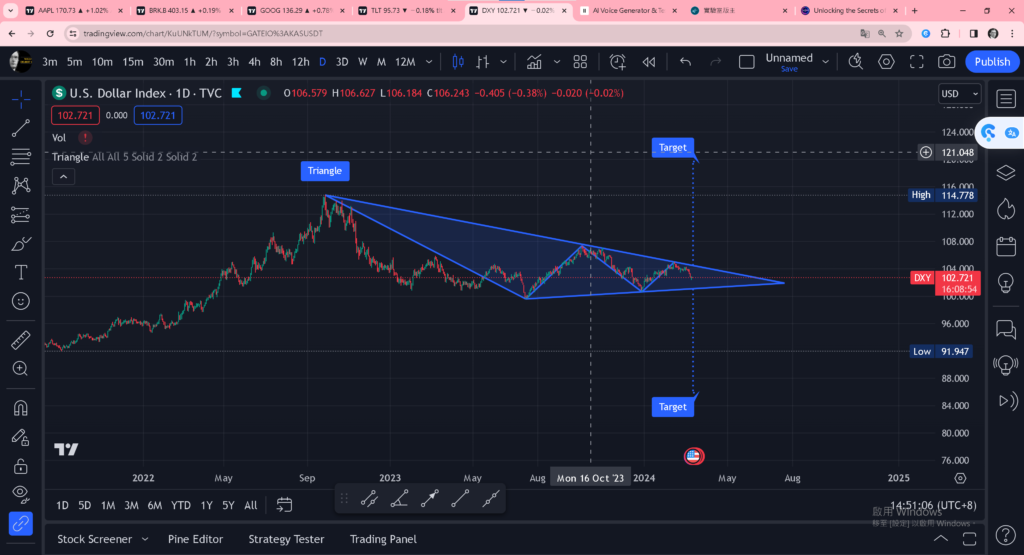
The Descending Triangle pattern typically forms during a downtrend, signaling a period of consolidation before the continuation of the prevailing bearish trend. It consists of two converging trendlines – a downward-sloping resistance line and a horizontal support line. The lower highs signify waning bullish momentum, while the horizontal support line indicates a level at which selling pressure is absorbed, leading to a potential breakdown.
Characteristics and Structure
Identifying the Descending Triangle pattern involves recognizing its distinct characteristics. Traders observe a series of lower highs, indicating a gradual weakening of buying pressure, juxtaposed against a horizontal support line, representing a level where buyers step in to prevent further price declines.
Psychological Factors Influencing Formation
The formation of the Descending Triangle pattern is influenced by various psychological factors among market participants. As the price approaches the horizontal support line, bulls and bears engage in a tug-of-war, reflecting indecision and uncertainty in the market.
Identifying and Interpreting Descending Triangle Patterns
Recognizing and interpreting Descending Triangle patterns is crucial for traders seeking to capitalize on bearish market conditions. By understanding the key characteristics and implications of this pattern, traders can make informed decisions and execute profitable trades.
Recognizing Lower Highs and Horizontal Support
Traders employ technical analysis tools such as trendlines and chart patterns to identify Descending Triangle formations on price charts. By connecting consecutive lower highs and identifying a horizontal support line, traders can confirm the presence of a Descending Triangle pattern.
Bearish Implications and Market Sentiment
The Descending Triangle pattern carries bearish implications, suggesting a high probability of further downside movement. Market sentiment plays a significant role in pattern interpretation, with bearish sentiment driving the formation of lower highs and contributing to the pattern’s bearish bias.
Trading Strategies with Descending Triangle
Capitalizing on the Descending Triangle pattern requires a sound understanding of effective trading strategies tailored to exploit its bearish implications. Traders can utilize various techniques to maximize profit potential while minimizing risk exposure.
Short-selling Opportunities
Short-selling is a common strategy employed by traders to profit from bearish market conditions. By entering short positions near the breakdown point of the Descending Triangle pattern, traders can capitalize on downward price movements and generate profits.
Risk Management Techniques
Implementing robust risk management techniques is essential when trading the Descending Triangle pattern. Traders should establish clear entry and exit points, set stop-loss orders to limit potential losses, and adhere to disciplined trading strategies to mitigate risks effectively.
Volatility Indicators in Descending Triangle
Volatility indicators play a crucial role in validating Descending Triangle patterns and anticipating potential breakout scenarios. By understanding volatility dynamics and utilizing appropriate indicators, traders can gauge market sentiment and make informed trading decisions.
Understanding Volatility Indicators
Volatility indicators such as Bollinger Bands, Average True Range (ATR), and the Volatility Index (VIX) provide valuable insights into market volatility levels. Traders can use these indicators in conjunction with the Descending Triangle pattern to assess the likelihood of a breakout and adjust their trading strategies accordingly.
Anticipating Breakout Scenarios
Breakout trading is a common strategy employed by traders to capitalize on price movements following a period of consolidation. By monitoring volatility indicators and identifying potential breakout levels, traders can position themselves to profit from significant price movements resulting from Descending Triangle patterns.
Real-life Examples and Case Studies
Analyzing historical data and real-life examples of Descending Triangle patterns can provide valuable insights into its practical application in the financial markets. By studying past instances of this pattern, traders can gain a deeper understanding of its behavior and develop more effective trading strategies.
Analyzing Historical Data
Examining historical price charts and identifying instances of Descending Triangle patterns allows traders to observe how the pattern behaves in different market conditions. By studying past price movements and outcomes, traders can enhance their ability to recognize and interpret Descending Triangle patterns accurately.
Successful Trades Based on Descending Triangle Patterns
Case studies highlighting successful trades based on Descending Triangle patterns offer practical insights into the pattern’s profitability and effectiveness as a trading signal. By studying these examples, traders can learn from real-life experiences and improve their trading performance in the future.
Common Mistakes to Avoid
While trading the Descending Triangle pattern, it’s essential for traders to be aware of common pitfalls and mistakes that can undermine their success. By understanding these pitfalls and implementing appropriate risk management techniques, traders can avoid unnecessary losses and improve their overall trading performance.
Premature Entries
One common mistake made by traders is entering trades prematurely, before the Descending Triangle pattern has fully formed or confirmed. Premature entries increase the risk of losses and can result in missed opportunities for profitable trades.
Lack of Risk Management
Another common mistake is failing to implement proper risk management techniques when trading the Descending Triangle pattern. Traders should establish clear risk-reward ratios, set stop-loss orders, and adhere to disciplined trading strategies to mitigate potential losses and preserve capital.
Market Sentiment and Descending Triangle
Market sentiment plays a significant role in shaping the behavior of Descending Triangle patterns and influencing traders’ decision-making processes. By understanding how market sentiment affects pattern formation and interpretation, traders can gain valuable insights into potential price movements and adjust their trading strategies accordingly.
Impact of Market Sentiment on Pattern Formation
Bearish market sentiment often drives the formation of Descending Triangle patterns, as investors and traders anticipate further downside movement in the price of an asset. By monitoring shifts in market sentiment, traders can gauge the strength of the pattern and make more informed trading decisions.
Recognizing Shifts in Sentiment
Identifying shifts in market sentiment is essential for traders seeking to capitalize on Descending Triangle patterns. Changes in sentiment can signal potential reversals or breakout opportunities, providing traders with valuable insights into market dynamics and potential price movements.
Conclusion
In conclusion, the Descending Triangle pattern is a powerful tool for traders seeking to identify and capitalize on bearish market conditions. By understanding its formation, interpretation, and practical implications, traders can enhance their ability to recognize profitable trading opportunities and navigate the financial markets with confidence.
FAQs (Frequently Asked Questions)
- What is the significance of the Descending Triangle pattern in technical analysis? The Descending Triangle pattern serves as a reliable indicator of potential bearish continuation in the financial markets, offering traders valuable insights into market dynamics.
- How can traders differentiate between the Descending Triangle and other chart patterns? Traders can distinguish the Descending Triangle pattern by its characteristic lower highs and horizontal support line, setting it apart from other chart patterns such as the Ascending Triangle or Symmetrical Triangle.
- What are some common pitfalls to avoid when trading the Descending Triangle pattern? Traders should exercise caution against premature entries or disregarding risk management principles, ensuring disciplined adherence to trading strategies and market analysis.
- Can the Descending Triangle pattern be applied across different asset classes? Yes, the Descending Triangle pattern is applicable across various asset classes, including stocks, forex, commodities, and cryptocurrencies, offering versatile trading opportunities for market participants.
- What role does volume play in validating the Descending Triangle pattern? Volume serves as a critical confirmation tool for validating the Descending Triangle pattern, with decreasing volume during the consolidation phase indicating potential bearish momentum.
- #DescendingTriangle
- #TechnicalAnalysis
- #TradingStrategies
- #StockMarket
- #ForexTrading
- #Crypto
- #InvestingTips
- #MarketAnalysis
- #FinancialEducation
- #ProfitableTrading
Tags:
- Descending Triangle
- Technical Analysis
- Trading Strategies
- Stock Market
- Forex Trading
- Cryptocurrency
- Market Analysis
- Financial Education
- Trading Tips
- Bearish Continuation Pattern
- Chart Patterns
- Market Sentiment
- Risk Management
- Price Action
- Candlestick Patterns
- Support and Resistance
- Market Psychology
- Breakout Trading
- Trend Analysis
- Profit Potential
- Volatility Indicators
- Market Trends
- Trading Psychology
- Market Volatility
- Financial Markets
- Trading Signals
- Technical Indicators
- Trading Education
- Trading Community
- Trader Lifestyle
- Day Trading
- Swing Trading
- Long-Term Investing
- Trading Opportunities
- Market Dynamics
