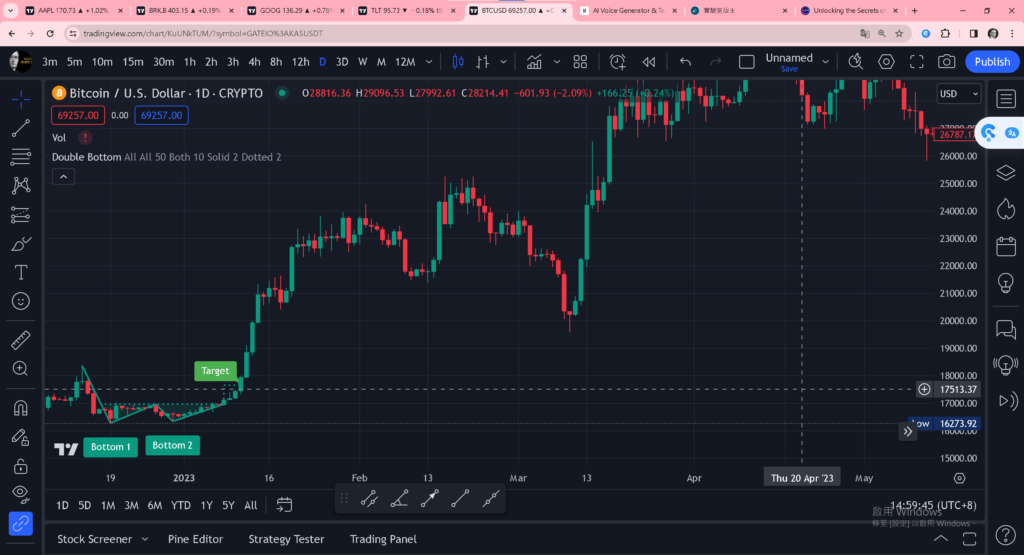
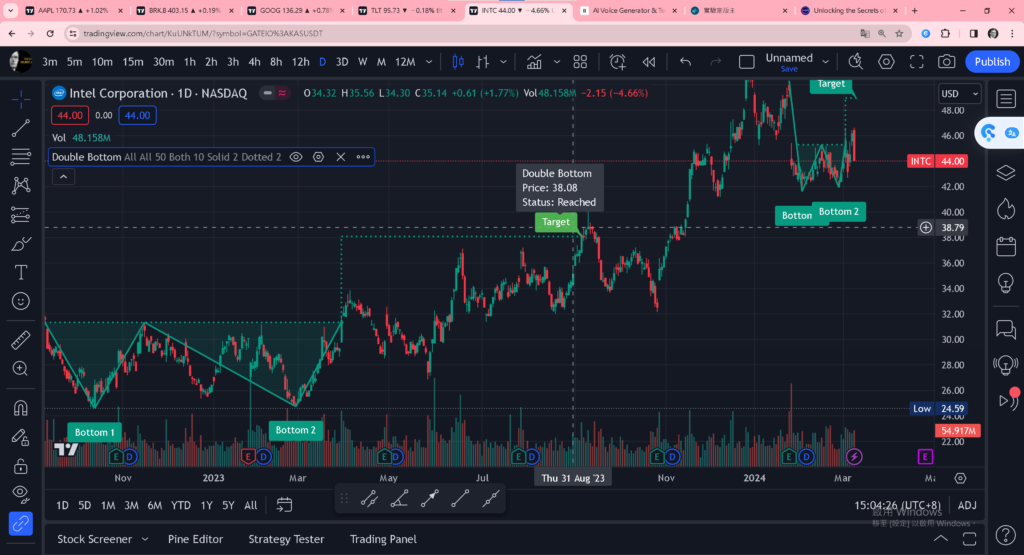
Double Bottom
Double Bottom: The Powerful Pattern in Stock Trading

Table of Contents
In the realm of stock trading, patterns are like roadmaps guiding investors through the tumultuous terrain of the market. One such pattern that has gained significant attention and reverence among traders is the Double Bottom. This pattern, when identified and interpreted correctly, can provide valuable insights into potential market reversals and lucrative trading opportunities. In this comprehensive guide, we’ll delve into the intricacies of the Double Bottom pattern, understanding its significance, identifying its characteristics, and exploring strategies to capitalize on its presence.
Understanding the Double Bottom Pattern
What is a Double Bottom?
A Double Bottom is a bullish reversal pattern that forms after a downtrend in a stock’s price. As the name suggests, it consists of two distinct troughs (or bottoms) separated by a peak, resembling the letter “W” on a price chart. This pattern signifies a shift in market sentiment from bearish to bullish, indicating that the stock may be poised for an upward trend reversal.
Key Characteristics of a Double Bottom
1. Two Troughs: The most evident characteristic of a Double Bottom pattern is the presence of two consecutive troughs, indicating a period of price decline followed by stabilization.
2. Rounded Bottoms: Unlike sharp V-shaped bottoms seen in some patterns, the bottoms of a Double Bottom tend to be more rounded, suggesting gradual accumulation by buyers.
3. Peak or Resistance Level: Between the two troughs, there exists a peak or a resistance level, representing a temporary barrier for price advancement.
4. Volume Confirmation: Ideally, the volume should decline as the pattern forms and then increase as the price breaks above the peak, confirming the validity of the reversal.
Identifying Double Bottom Patterns
Chart Analysis
Identifying Double Bottom patterns requires a keen eye for chart patterns and technical analysis. Traders often use candlestick charts or bar charts to spot these formations. Here’s a step-by-step guide to identifying Double Bottom patterns:
- Downtrend Recognition: Look for a prolonged downtrend in the stock’s price chart.
- First Trough: Identify the first trough, where the price reaches a low point and starts to stabilize.
- Recovery and Peak: After the first trough, the price should experience a moderate recovery, forming a peak or a resistance level.
- Second Trough: Following the peak, the price should decline again, forming the second trough at a similar level to the first one.
- Breakout Confirmation: Confirm the pattern by waiting for the price to break above the peak or resistance level, accompanied by increased volume.
Technical Indicators
In addition to visual analysis, traders often use technical indicators to confirm Double Bottom patterns. Common indicators include:
- Moving Averages: The crossover of short-term and long-term moving averages can signal a potential reversal.
- Relative Strength Index (RSI): Oversold conditions indicated by RSI can complement the formation of Double Bottom patterns.
- Volume Analysis: Analyzing volume trends can provide further confirmation of the pattern’s validity.
Trading Strategies for Double Bottom Patterns
Entry Strategies
1. Breakout Entry: Enter a long position once the price breaks above the peak or resistance level with strong volume confirmation.
2. Pullback Entry: Wait for a pullback after the breakout and enter at a favorable price point, ensuring confirmation of the pattern.
Stop-loss and Take-profit Levels
1. Stop-loss: Place a stop-loss order below the second trough or the breakout point to limit potential losses in case of a reversal.
2. Take-profit: Set a target price based on the height of the pattern or key resistance levels identified on the chart.
Risk Management
– Position Sizing: Determine the appropriate position size based on your risk tolerance and the distance between entry and stop-loss levels.
– Diversification: Avoid overexposure to any single trade by diversifying your portfolio across different assets or sectors.
Conclusion
In conclusion, the Double Bottom pattern is a potent tool in a trader’s arsenal, offering valuable insights into potential market reversals and profitable trading opportunities. By understanding the key characteristics, identifying the formation, and implementing effective trading strategies, traders can harness the power of this pattern to navigate the dynamic landscape of the stock market with confidence and precision. Remember, patience and discipline are key virtues in trading, and mastering the art of pattern recognition can significantly enhance your success as a trader.
FAQs
- What is a Double Bottom pattern? A Double Bottom pattern is a bullish reversal pattern that forms after a downtrend in a stock’s price, indicating a potential upward trend reversal.
- How do I identify a Double Bottom pattern? Look for two distinct troughs separated by a peak on a price chart, signaling a shift from bearish to bullish sentiment.
- What are some common trading strategies for Double Bottom patterns? Common strategies include entering long positions after a breakout above the peak and setting stop-loss orders below the second trough.
- What are the benefits of trading based on Double Bottom patterns? Trading based on Double Bottom patterns can lead to increased profitability, enhanced risk-adjusted returns, and improved trading confidence.
- What are some common mistakes to avoid when interpreting Double Bottom patterns? Avoid mistaking Double Bottom patterns for other formations, overlooking volume confirmation, and neglecting proper risk management techniques.
- How does a Double Bottom pattern compare to other chart patterns? Double Bottom patterns have distinct characteristics compared to other patterns, such as Double Tops and Head and Shoulders formations, offering unique trading opportunities.

