Double Top: A Comprehensive Guide to Spotting and Trading
In the world of financial markets, technical analysis plays a crucial role in identifying potential price movements. Among the various chart patterns traders rely on, the double top stands out as a significant indicator of a potential trend reversal. Understanding this pattern can provide valuable insights into market sentiment and help traders make informed decisions.
Introduction to Double Top
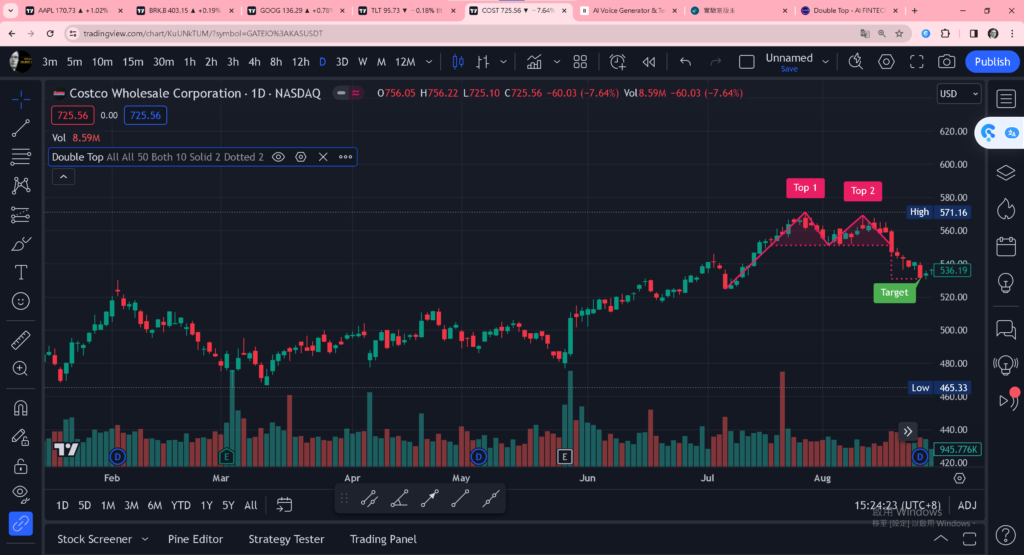
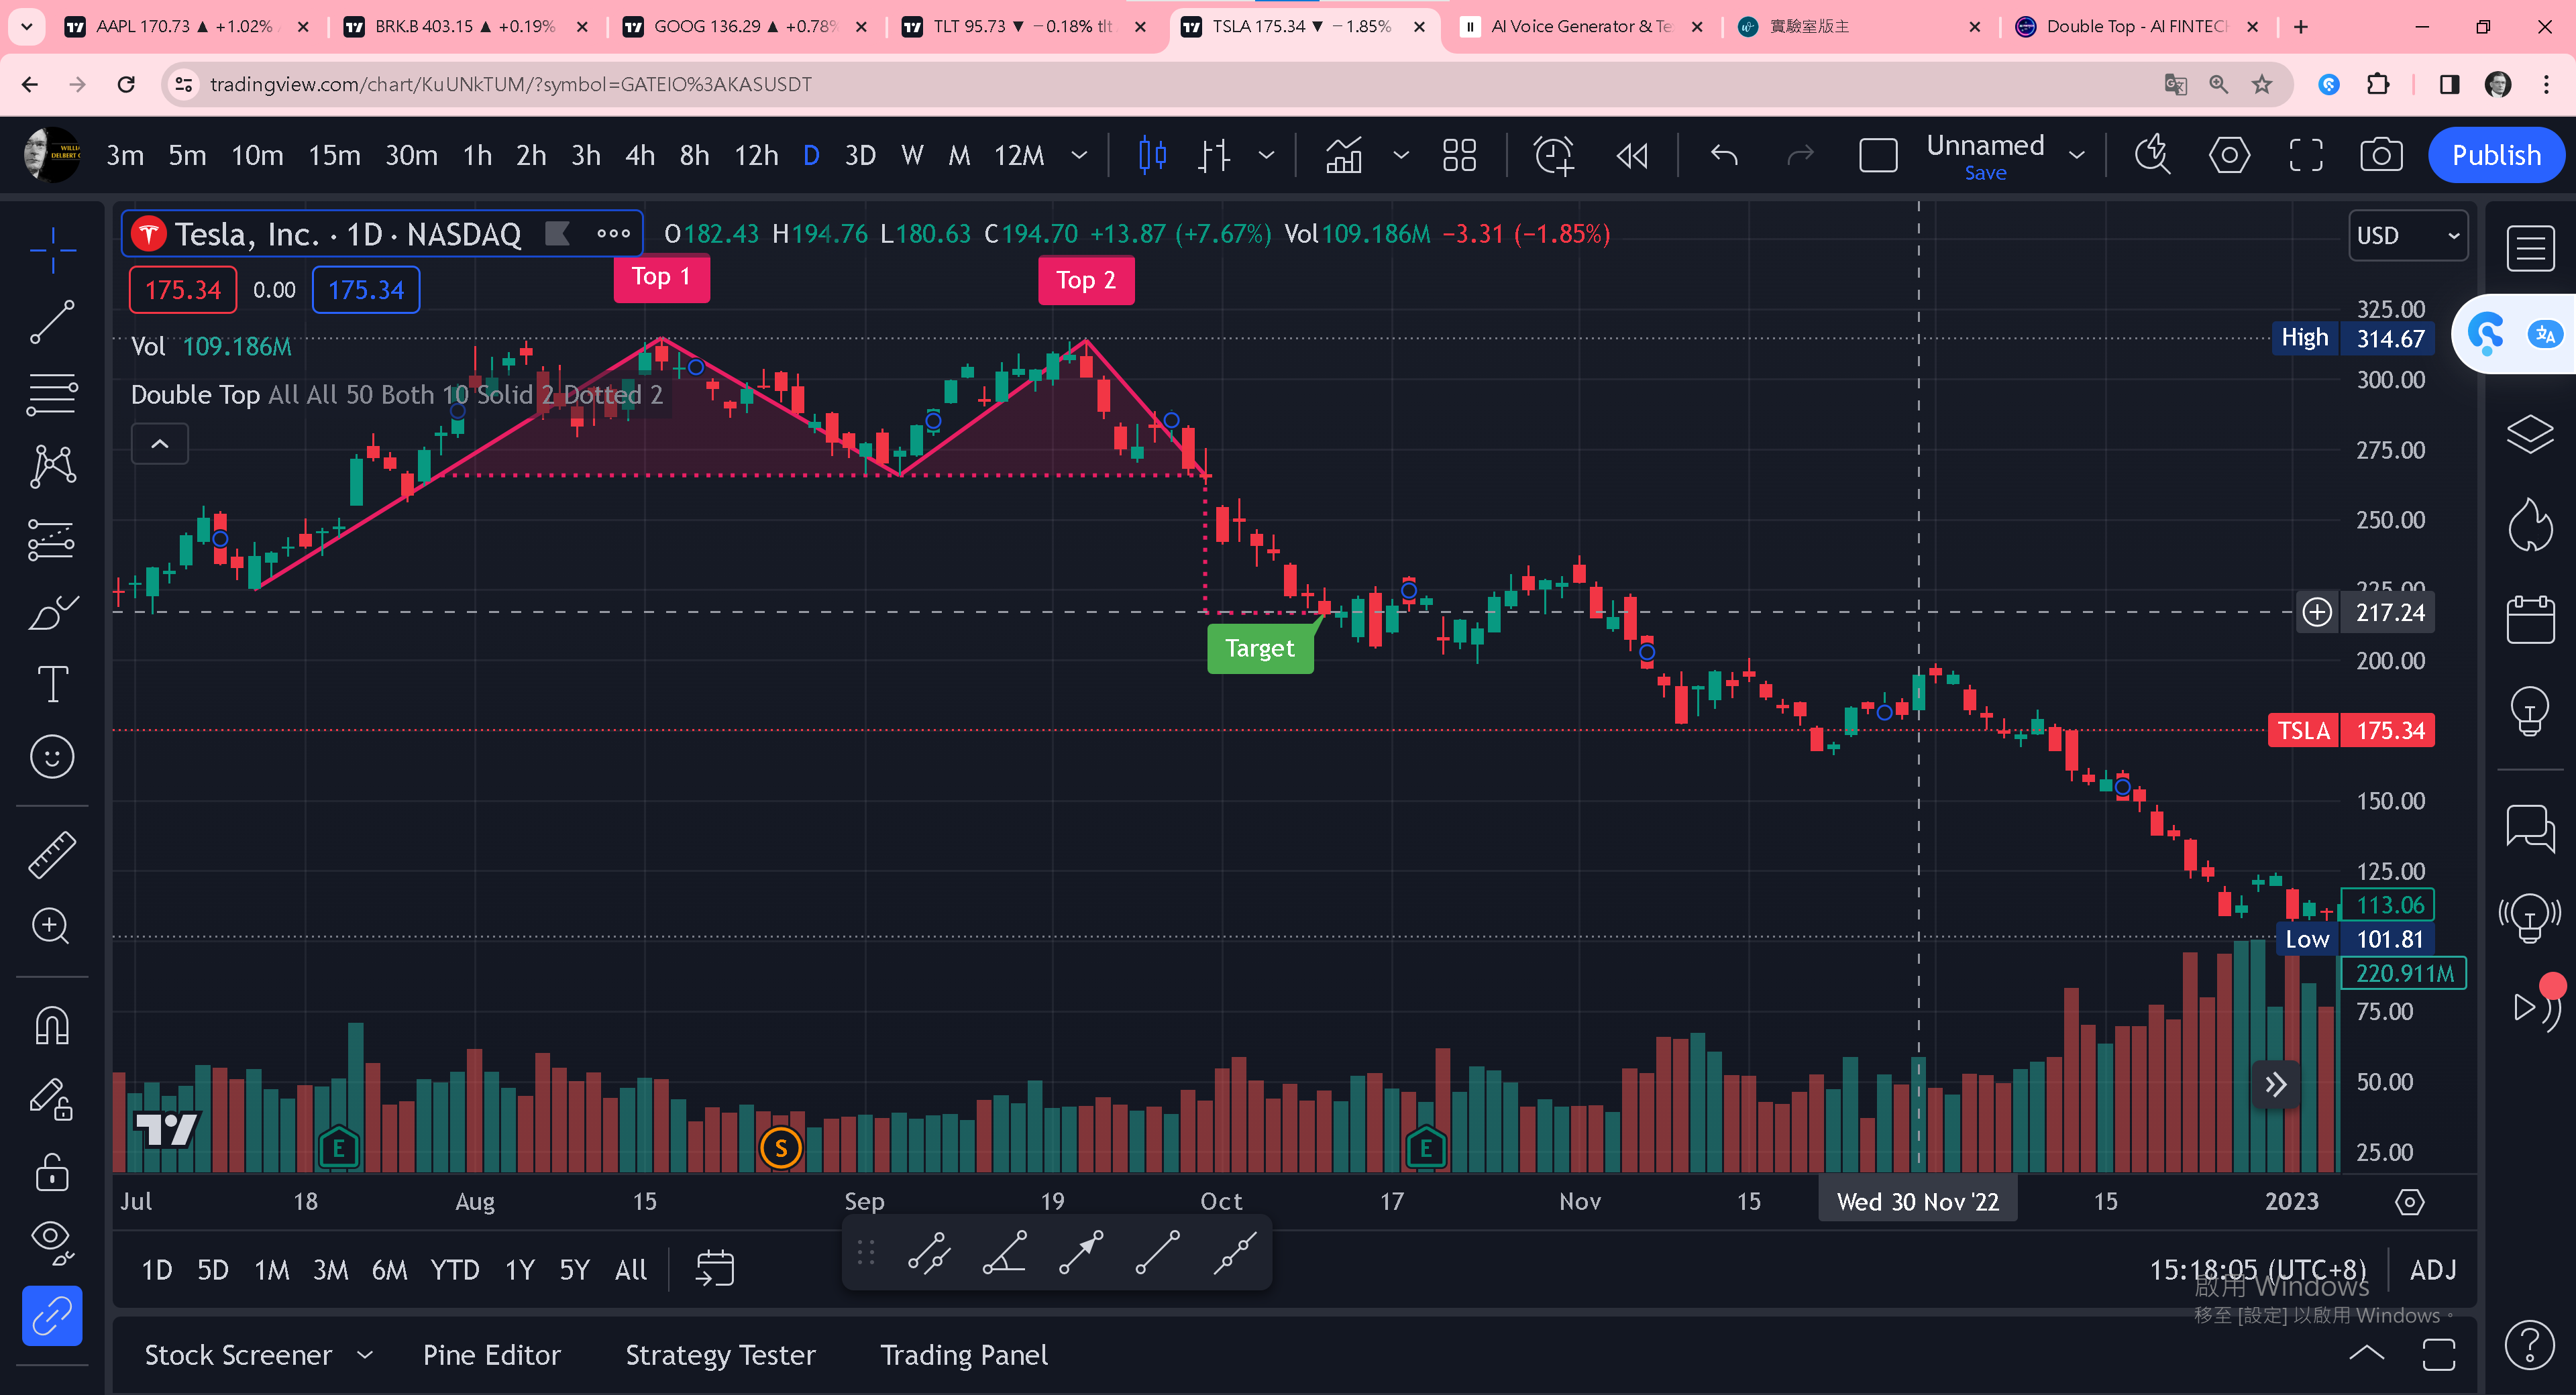
A double top is a bearish reversal pattern that occurs after an uptrend. It is characterized by two peaks of approximately the same height, separated by a trough. This pattern indicates that the upward momentum is weakening, and a trend reversal may be imminent.
Understanding the Formation
Identifying a double top requires careful observation of price movements on a chart. Traders look for two distinct peaks, followed by a trough between them. The second peak should not exceed the height of the first peak significantly. This formation suggests that buyers are becoming less enthusiastic, and sellers may soon gain control.
Psychology Behind Double Top
The formation of a double top reflects a shift in market sentiment. After a prolonged uptrend, investors who bought early may start taking profits, causing the price to stall and eventually reverse. Additionally, new buyers may hesitate to enter the market at higher prices, contributing to the formation of the second peak.
Recognizing Double Top on Charts
Traders employ various techniques to confirm the presence of a double top pattern on a chart. These include analyzing volume, studying price action around the peaks, and using trendlines to identify support and resistance levels. Confirmation signals such as a break below the trough or a decline in volume further validate the pattern.
Trading Strategies for Double Top
Once a double top pattern is identified, traders can implement specific strategies to capitalize on the anticipated reversal. Entry points typically occur after the price breaks below the trough, signaling a potential downtrend. Stop-loss orders are placed above the second peak to manage risk, while profit targets may be set based on the depth of the pattern.
Double Top in Different Markets
The double top pattern is not limited to any particular market and can be observed across various asset classes. Whether trading stocks, forex, or cryptocurrency, the principles of identifying and trading double tops remain consistent. However, it is essential to consider the unique characteristics of each market and adjust trading strategies accordingly.
Common Mistakes to Avoid
Traders should exercise caution when interpreting double top patterns to avoid common pitfalls. These include mistaking minor price fluctuations for significant reversals and overlooking confirmation factors such as volume and price action. Patience and discipline are key to successfully trading this pattern.
Case Studies and Examples
Examining real-life examples of double top formations can provide valuable insights into how this pattern behaves in different market conditions. By studying historical data and analyzing past trends, traders can better understand the nuances of double top patterns and improve their decision-making process.
Alternatives to Double Top
While the double top pattern is widely recognized, it is not the only indicator of a potential trend reversal. Traders may also consider alternative chart patterns such as head and shoulders or triangles, which offer different perspectives on market dynamics. Diversifying analysis techniques can enhance trading strategies and reduce reliance on any single pattern.
Conclusion
In conclusion, mastering the art of identifying and trading double top patterns is essential for any trader looking to navigate the complexities of financial markets successfully. By understanding the formation, psychology, and trading strategies associated with double tops, traders can gain a competitive edge and improve their overall performance.
Unique FAQs
- Is the double top pattern always a reliable indicator of a trend reversal?
- While double tops can signal potential reversals, they are not foolproof. Traders should use additional confirmation signals and consider other factors before making trading decisions.
- Can double top patterns occur on intraday charts?
- Yes, double tops can form on intraday charts as well. However, traders should be cautious when relying on shorter timeframes and ensure that the pattern is validated by sufficient volume and price action.
- Are there any software tools available to help identify double top patterns?
- Yes, many trading platforms offer built-in tools and indicators that can assist traders in identifying double top patterns. Additionally, there are standalone software solutions specifically designed for technical analysis.
- What is the typical duration of a double top pattern?
- The duration of a double top pattern can vary depending on the timeframe of the chart and market conditions. Some patterns may unfold over several weeks or months, while others may occur more rapidly.
- How can traders differentiate between a double top and a triple top pattern?
- A double top consists of two peaks separated by a trough, while a triple top has three peaks with two intervening troughs. Traders should carefully analyze the structure and symmetry of the pattern to determine its classification.
- #DoubleTop
- #TradingTips
- #TechnicalAnalysis
- #StockMarket
- #ForexTrading
- #Cryptocurrency
- #MarketAnalysis
- #TradingStrategies
- #Investing
- #ProfitableTrading
- Double Top Trading
- Spotting Double Top
- Trading Strategies
- Technical Analysis
- Market Sentiment
- Trader Psychology
- Trend Reversal
- Risk Management
- Stock Market Trends
- Forex Patterns
- Cryptocurrency Trading
- Trading Indicators
- Price Action Analysis
- Market Psychology
- Trading Education
- Market Trends
- Profitable Trading Strategies
- Trading Patterns
- Chart Analysis
- Financial Markets
- Trading Insights
- Trading Techniques
- Trading Signals
- Investment Strategies
- Market Forecast
- Trading Education
- Trading Signals
- Trading Community
- Trading Mentorship
- Trading Resources
- Market Analysis
- Trading Tools
- Trading Software
- Trading Platforms
- Trading Academy