Discover the Hidden Potential of Falling Wedge in Technical Analysis
Are you an investor or trader looking to dive into the world of technical analysis? If so, you’ve likely come across various chart patterns that can help predict future price movements. One such pattern that holds significant importance is the falling wedge. In this comprehensive guide, we’ll unravel the mysteries of the falling wedge pattern, understanding its significance, how to identify it, and most importantly, how to leverage it to your advantage.
Understanding the Falling Wedge Pattern
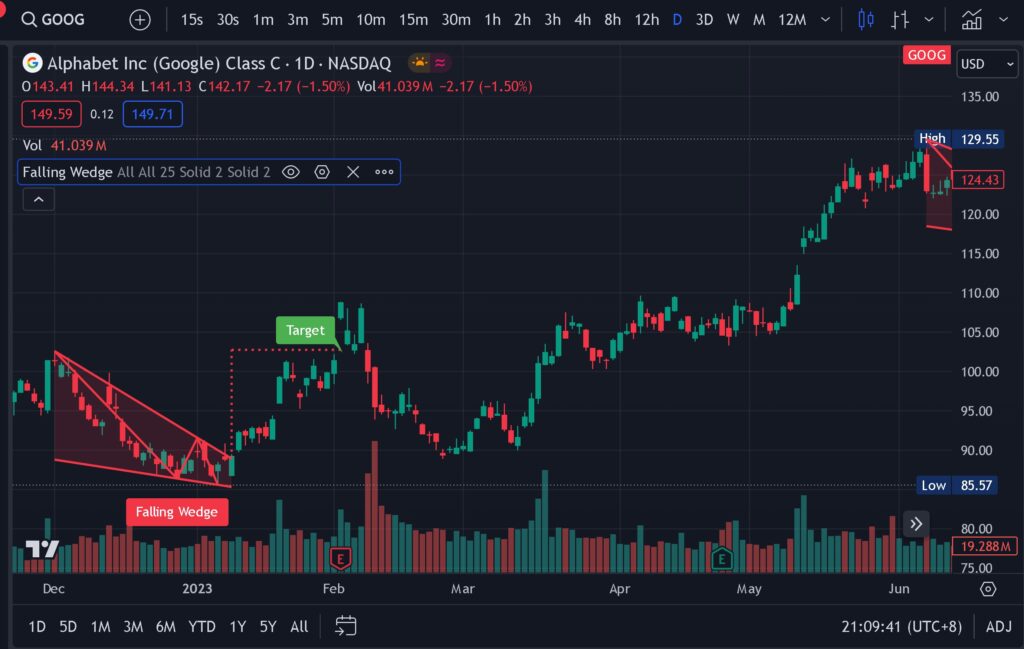
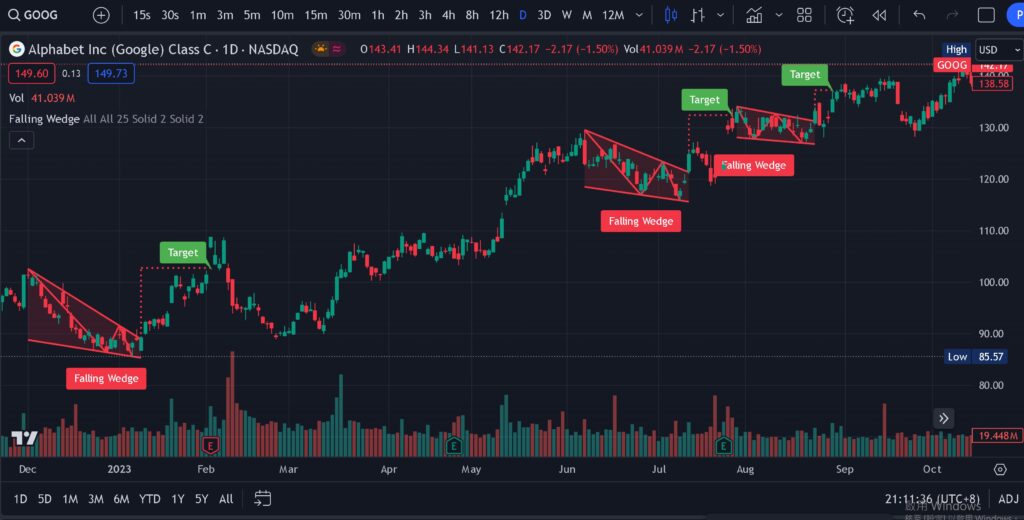
The falling wedge pattern is a bullish continuation pattern that occurs during a downtrend. It resembles a triangle pointing downwards, with both trendlines slanting in the same direction. Despite its name, the falling wedge typically signals a potential reversal in the current downtrend rather than a continuation. This pattern is characterized by diminishing trading volumes as the price consolidates within the wedge formation.
Identifying the Falling Wedge Pattern
To effectively utilize the falling wedge pattern, it’s crucial to identify it accurately on price charts. Here are the key characteristics to look for:
1. Converging Trendlines
The falling wedge pattern consists of two converging trendlines: a downtrend line (resistance) and a support line (slope downwards). These trendlines should intersect at a point known as the apex.
2. Decreasing Trading Volume
As the price action unfolds within the falling wedge, trading volume tends to diminish. This decrease in volume indicates a weakening bearish momentum and suggests a potential reversal.
3. Length and Duration
The duration of the falling wedge pattern can vary, but it typically lasts anywhere from several weeks to a few months. Traders should observe the length of the pattern to gauge its significance.
Trading Strategies with the Falling Wedge Pattern
Now that we’ve grasped the fundamentals of the falling wedge pattern, let’s explore some effective trading strategies to capitalize on its signals:
1. Wait for Confirmation
Before entering a trade based on the falling wedge pattern, it’s essential to wait for confirmation. This often involves the price breaking above the upper trendline with a significant increase in volume, signaling a bullish breakout.
2. Set Price Targets
Upon confirmation of the bullish breakout, traders can establish price targets by measuring the height of the wedge pattern and projecting it upwards from the breakout point. These targets can help traders gauge potential price movements.
3. Implement Risk Management
As with any trading strategy, risk management is paramount. Traders should set stop-loss orders to limit potential losses in case the trade doesn’t unfold as anticipated. Additionally, consider employing proper position sizing to manage risk effectively.
Conclusion
In conclusion, the falling wedge pattern is a powerful tool in the arsenal of technical analysts. By understanding its characteristics and implementing strategic trading approaches, investors can capitalize on bullish opportunities within a downtrend. Remember to exercise caution, conduct thorough analysis, and always prioritize risk management in your trading endeavors. Happy trading!
Hashtags:
#TechnicalAnalysis #FallingWedge #TradingStrategies #InvestingTips #StockMarket #TradingPatterns #FinancialEducation #ChartAnalysis #MarketAnalysis #TradingSuccess
SEO Tags:
Falling Wedge, Technical Analysis, Trading Strategies, Chart Patterns, Stock Market, Financial Education, Trading Tips, Market Analysis, Trading Success, Investing, Pattern Recognition, Bullish Patterns, Downtrend, Continuation Patterns, Price Movements, Trendlines, Trading Volume, Breakout Strategies, Risk Management, Profitable Trading.
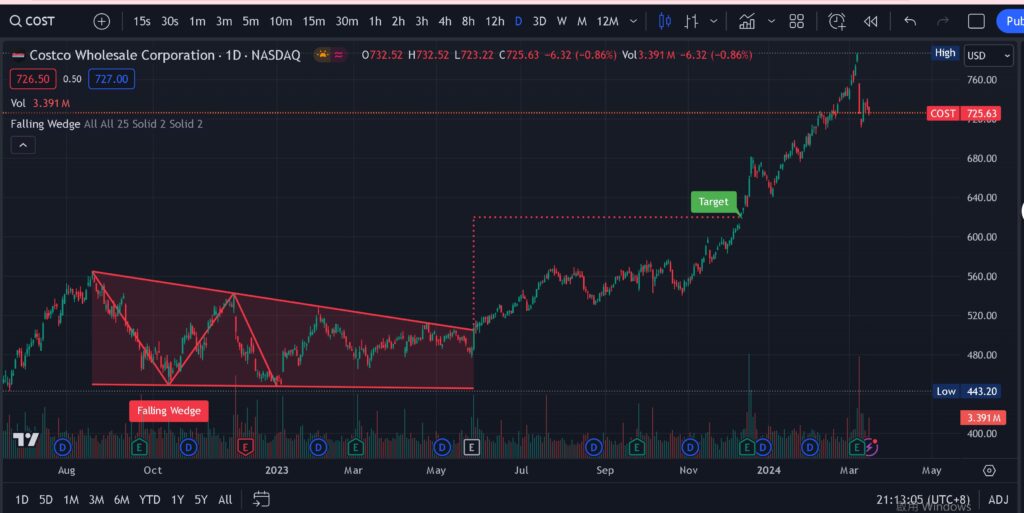
The patterns mentioned above no longer require manual drawing. You can directly use TradingView to automatically plot these patterns. You can find more information about TradingView and its features, including pattern recognition tools, on their website: TradingView Pricing